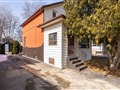
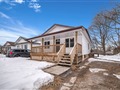
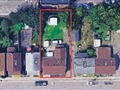
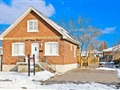
93 Olive Ave
$589,793
Comparative Market Analysis
Jun 30, 2025
NOT AN ACTIVE LISTING
Historical Performance
| Period | $ Change | % Change |
| 1 Day | +$187 | +0.032% |
| 7 Days | +$300 | +0.051% |
| 30 Days | -$295 | -0.050% |
| 3 Months | +$358 | +0.061% |
| 6 Months | +$13.7k | +2.38% |
| 1 Year | -$17.6k | -2.90% |
| 3 Years | +$138k | +30.5% |
| 5 Years | +$244k | +70.6% |
| 10 Years | +$427k | +262% |
List My Property
Real Estate Statistics
Financing Solutions
AS SEEN ON


Are You a Licensed Real Estate Agent or Broker?