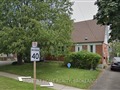
829 Masson St
$754,608
Comparative Market Analysis
Jul 9, 2025
NOT AN ACTIVE LISTING
Historical Performance
| Period | $ Change | % Change |
| 1 Day | +$222 | +0.029% |
| 7 Days | +$105 | +0.014% |
| 30 Days | -$1,576 | -0.208% |
| 3 Months | -$3,151 | -0.416% |
| 6 Months | +$10.3k | +1.39% |
| 1 Year | -$39.7k | -5.00% |
| 3 Years | +$126k | +20.0% |
| 5 Years | +$208k | +38.1% |
| 10 Years | +$423k | +127% |
List My Property
Real Estate Statistics
Financing Solutions
AS SEEN ON


Are You a Licensed Real Estate Agent or Broker?