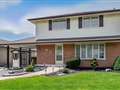
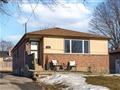
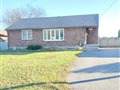
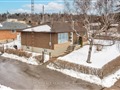
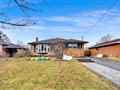
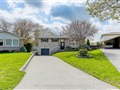
823 Florell Dr
$925,164
Comparative Market Analysis
May 31, 2025
NOT AN ACTIVE LISTING
Historical Performance
| Period | $ Change | % Change |
| 1 Day | +$279 | +0.030% |
| 7 Days | +$195 | +0.021% |
| 30 Days | -$1,678 | -0.181% |
| 3 Months | -$3,161 | -0.340% |
| 6 Months | +$14.0k | +1.53% |
| 1 Year | -$45.5k | -4.69% |
| 3 Years | +$161k | +21.0% |
| 5 Years | +$283k | +44.1% |
| 10 Years | +$549k | +146% |
List My Property
Real Estate Statistics
Financing Solutions
Browsing History
258 Galway Crt, Oshawa
1 second ago
598 Capilano Cres, Oshawa
2 seconds ago
133 Oriole St, Oshawa
3 seconds ago
173 Mill St, Oshawa
4 seconds ago
640 Capilano Cres, Oshawa
5 seconds ago
186 Athabasca St, Oshawa
6 seconds ago
524 Lisbon Crt, Oshawa
7 seconds ago
198 Maclaren St, Oshawa
8 seconds ago
956 Coyston Dr, Oshawa
9 seconds ago
AS SEEN ON


Are You a Licensed Real Estate Agent or Broker?