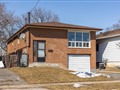
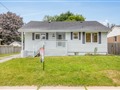
73 Westmount St
$426,176
Comparative Market Analysis
Jul 2, 2025
NOT AN ACTIVE LISTING
Historical Performance
| Period | $ Change | % Change |
| 1 Day | +$133 | +0.031% |
| 7 Days | +$86 | +0.020% |
| 30 Days | -$838 | -0.196% |
| 3 Months | -$1,744 | -0.407% |
| 6 Months | +$5,778 | +1.37% |
| 1 Year | -$22.3k | -4.97% |
| 3 Years | +$69.9k | +19.6% |
| 5 Years | +$125k | +41.6% |
| 10 Years | +$257k | +151% |
List My Property
Real Estate Statistics
Financing Solutions
AS SEEN ON


Are You a Licensed Real Estate Agent or Broker?