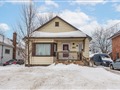
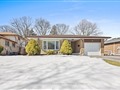
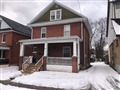
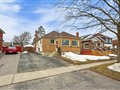
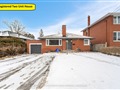
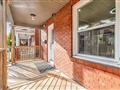
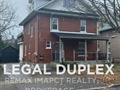
630 Grierson St
$719,828
Comparative Market Analysis
Jun 7, 2025
NOT AN ACTIVE LISTING
Historical Performance
| Period | $ Change | % Change |
| 1 Day | +$222 | +0.031% |
| 7 Days | +$193 | +0.027% |
| 30 Days | -$1,148 | -0.159% |
| 3 Months | -$2,035 | -0.282% |
| 6 Months | +$11.7k | +1.65% |
| 1 Year | -$33.5k | -4.45% |
| 3 Years | +$130k | +22.0% |
| 5 Years | +$225k | +45.4% |
| 10 Years | +$437k | +155% |
List My Property
Real Estate Statistics
Financing Solutions
Browsing History
741 Clifton Dr, Oshawa
6 seconds ago
374 Burnley Crt, Oshawa
11 seconds ago
62 Buckingham Ave, Oshawa
16 seconds ago
AS SEEN ON

Are You a Licensed Real Estate Agent or Broker?