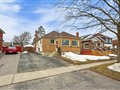
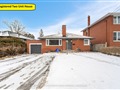
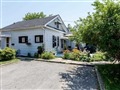
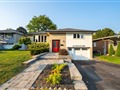
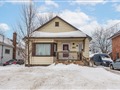
573 Pinewood St
$848,674
Comparative Market Analysis
Jun 15, 2025
NOT AN ACTIVE LISTING
Historical Performance
| Period | $ Change | % Change |
| 1 Day | +$262 | +0.031% |
| 7 Days | +$158 | +0.019% |
| 30 Days | -$1,694 | -0.199% |
| 3 Months | -$3,489 | -0.409% |
| 6 Months | +$11.5k | +1.38% |
| 1 Year | -$30.1k | -3.42% |
| 3 Years | +$255k | +43.1% |
| 5 Years | +$381k | +81.5% |
| 10 Years | +$545k | +180% |
List My Property
Real Estate Statistics
Financing Solutions
AS SEEN ON


Are You a Licensed Real Estate Agent or Broker?