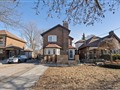
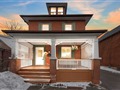
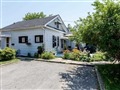
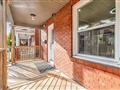
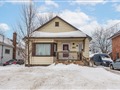
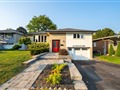
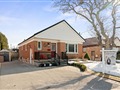
489 Harwood Dr
$665,656
Comparative Market Analysis
Jul 6, 2025
NOT AN ACTIVE LISTING
Historical Performance
| Period | $ Change | % Change |
| 1 Day | +$205 | +0.031% |
| 7 Days | +$130 | +0.020% |
| 30 Days | -$1,299 | -0.195% |
| 3 Months | -$2,641 | -0.395% |
| 6 Months | +$9,238 | +1.41% |
| 1 Year | -$34.4k | -4.92% |
| 3 Years | +$110k | +19.8% |
| 5 Years | +$191k | +40.3% |
| 10 Years | +$378k | +131% |
List My Property
Real Estate Statistics
Financing Solutions
Browsing History
568 Brentwood Ave, Oshawa
6 seconds ago
460 Harwood Dr, Oshawa
11 seconds ago
98 Patricia Ave, Oshawa
14 seconds ago
AS SEEN ON

Are You a Licensed Real Estate Agent or Broker?