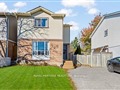
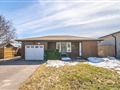
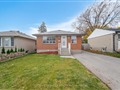
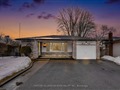
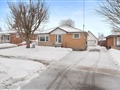
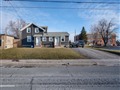
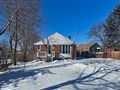
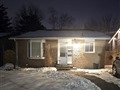
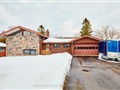
42 Sandcliff Dr
$897,204
Comparative Market Analysis
May 30, 2025
NOT AN ACTIVE LISTING
Historical Performance
| Period | $ Change | % Change |
| 1 Day | +$273 | +0.030% |
| 7 Days | +$233 | +0.026% |
| 30 Days | -$1,437 | -0.160% |
| 3 Months | -$2,502 | -0.278% |
| 6 Months | +$14.6k | +1.66% |
| 1 Year | -$41.5k | -4.43% |
| 3 Years | +$180k | +25.1% |
| 5 Years | +$302k | +50.7% |
| 10 Years | +$563k | +169% |
List My Property
Real Estate Statistics
Financing Solutions
AS SEEN ON


Are You a Licensed Real Estate Agent or Broker?