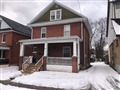
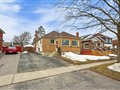
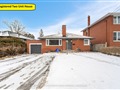
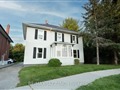
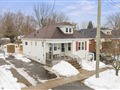
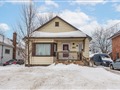
400 Masson St
$842,341
Comparative Market Analysis
Jul 9, 2025
NOT AN ACTIVE LISTING
Historical Performance
| Period | $ Change | % Change |
| 1 Day | +$260 | +0.031% |
| 7 Days | +$213 | +0.025% |
| 30 Days | -$1,410 | -0.167% |
| 3 Months | -$2,582 | -0.306% |
| 6 Months | +$13.3k | +1.60% |
| 1 Year | -$39.9k | -4.52% |
| 3 Years | +$151k | +21.8% |
| 5 Years | +$263k | +45.3% |
| 10 Years | +$504k | +149% |
List My Property
Real Estate Statistics
Financing Solutions
AS SEEN ON


Are You a Licensed Real Estate Agent or Broker?