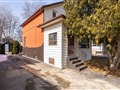
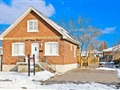
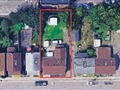
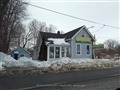
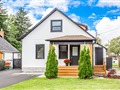
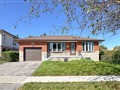
339 Bruce St
$652,211
Comparative Market Analysis
Jun 27, 2025
NOT AN ACTIVE LISTING
Historical Performance
| Period | $ Change | % Change |
| 1 Day | +$207 | +0.032% |
| 7 Days | +$305 | +0.047% |
| 30 Days | -$433 | -0.066% |
| 3 Months | +$247 | +0.038% |
| 6 Months | +$15.4k | +2.42% |
| 1 Year | -$16.5k | -2.47% |
| 3 Years | +$157k | +31.6% |
| 5 Years | +$233k | +55.7% |
| 10 Years | +$395k | +154% |
List My Property
Real Estate Statistics
Financing Solutions
Browsing History
1292 Northmount St, Oshawa
2 seconds ago
109 Bruce St, Oshawa
2 seconds ago
AS SEEN ON


Are You a Licensed Real Estate Agent or Broker?