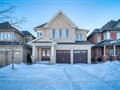
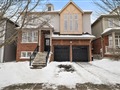
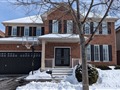
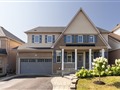
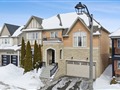
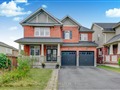
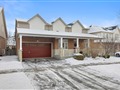
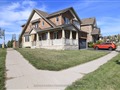
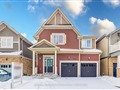
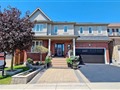
2383 Pilgrim Sq
$1,170,742
Comparative Market Analysis
Jun 19, 2025
NOT AN ACTIVE LISTING
Historical Performance
| Period | $ Change | % Change |
| 1 Day | +$321 | +0.027% |
| 7 Days | +$86 | +0.007% |
| 30 Days | -$2,598 | -0.221% |
| 3 Months | -$4,995 | -0.425% |
| 6 Months | +$16.1k | +1.40% |
| 1 Year | -$61.7k | -5.00% |
| 3 Years | +$255k | +27.9% |
| 5 Years | +$383k | +48.6% |
| 10 Years | +$718k | +158% |
List My Property
Real Estate Statistics
Financing Solutions
Browsing History
776 Regent Dr, Oshawa
1 second ago
AS SEEN ON


Are You a Licensed Real Estate Agent or Broker?