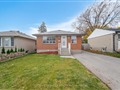
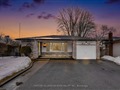
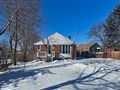
19 Sandcliff Dr
$985,538
Comparative Market Analysis
May 30, 2025
NOT AN ACTIVE LISTING
Historical Performance
| Period | $ Change | % Change |
| 1 Day | +$300 | +0.030% |
| 7 Days | +$275 | +0.028% |
| 30 Days | -$1,490 | -0.151% |
| 3 Months | -$2,466 | -0.250% |
| 6 Months | +$16.7k | +1.72% |
| 1 Year | -$44.4k | -4.31% |
| 3 Years | +$201k | +25.6% |
| 5 Years | +$336k | +51.8% |
| 10 Years | +$626k | +174% |
List My Property
Real Estate Statistics
Financing Solutions
AS SEEN ON


Are You a Licensed Real Estate Agent or Broker?